In this blog post, we address two topics that have recently dominated the media: on the one hand, neural networks and Artificial Intelligence (AI), and on the other, social media platforms such as Facebook, X, and others.
Processing graph-structured data with neural networks
To represent social networks mathematically, graphs are often used. Graphs are a field of discrete mathematics and theoretical computer science, offering diverse ways to represent various types of data. For example, in addition to social networks, they can also model telecommunications networks, chemical compounds like molecules, or connections in the brain. Their applications are thus quite versatile.
To process graph-structured data with neural networks, we need a neural network adapted to this type of data. The Graph Attention Network (GAT) builds upon the foundations of Graph Neural Networks (GNNs) and their advancements, such as the Graph Convolutional Network (GCN). The aim is to extract information about individual nodes within the graph and learn their properties to enable automatic node categorization. In this approach, the properties of all nodes in a neighborhood are weighted equally. However, this is not always meaningful, as some nodes may be more important in a relationship than others. To address this, the Graph Attention Network uses what is known as an attentional layer. But before delving into the theory behind the network, let’s first look at the dataset we want to train it on.
A look at the training datasets
Social networks like Facebook and X consist of massive amounts of data and continue to grow daily. The personal data of users is protected and cannot be easily used. Therefore, we will use smaller datasets as stand-ins to explain how GAT works. For this purpose, we select the publication networks Cora and CiteSeer. Both datasets are frequently used as examples in the literature, allowing us to compare the obtained results with other studies.
The datasets each consist of a graph that represents a publication network. The graph nodes represent publications, and the (undirected) edges represent the citations between the respective articles. Each node also has a feature vector that indicates whether a word from a given vocabulary is present in the publication (1) or not (0). Additionally, the nodes are assigned to a specific class corresponding to the thematic domains of the publications. This is summarized in the following table:
| Dataset | Cora | CiteSeer |
| Classes | 7 | 6 |
| Nodes | 2708 | 3327 |
| Edges | 5278 | 4552 |
| Features | 1433 | 3703 |

All the edges shown in Figure 1 are equally weighted. However, this does not always reflect reality accurately, so we want to assign higher weights to important edges and lower weights to less significant ones. This leads us directly to the neural network.
The Graph Attention Network
To express the variable weighting described above in numerical terms, we use the so-called self-attention method. This method, also used in natural language processing (NLP), is based on a normalized attention coefficient. The input to the Graph Attention Network consists of various feature vectors, while the output consists of higher-order feature vectors, which in our case correspond to the classes of the nodes. The attention coefficient is calculated as the product of the feature vectors and the weight matrix of the neural network. To make it comparable within a neighborhood, the coefficient must be normalized.
The normalized attention coefficient generated during the forward pass (the computation of the network’s output) provides a numerical value for the importance of a node relationship. However, this value can vary from calculation to calculation. To achieve a more accurate estimate, we calculate it multiple times. The number of calculations is referred to as attention heads. The results from individual heads are combined when in a hidden layer of the network. This must be considered when determining the size of the hidden layer (the hidden neurons layer, which is not observable during training). The number of desired neurons must be multiplied by the number of attention heads. In the final output layer, the average of the attention heads’ results is computed. Since the self-attention mechanism does not require information about the graph’s structure itself, the GAT can also be applied to inductive datasets that remain unseen during training. However, for simplicity, we limit ourselves in this example to transductive datasets, which are observable during training.
Training the Graph Attention Network
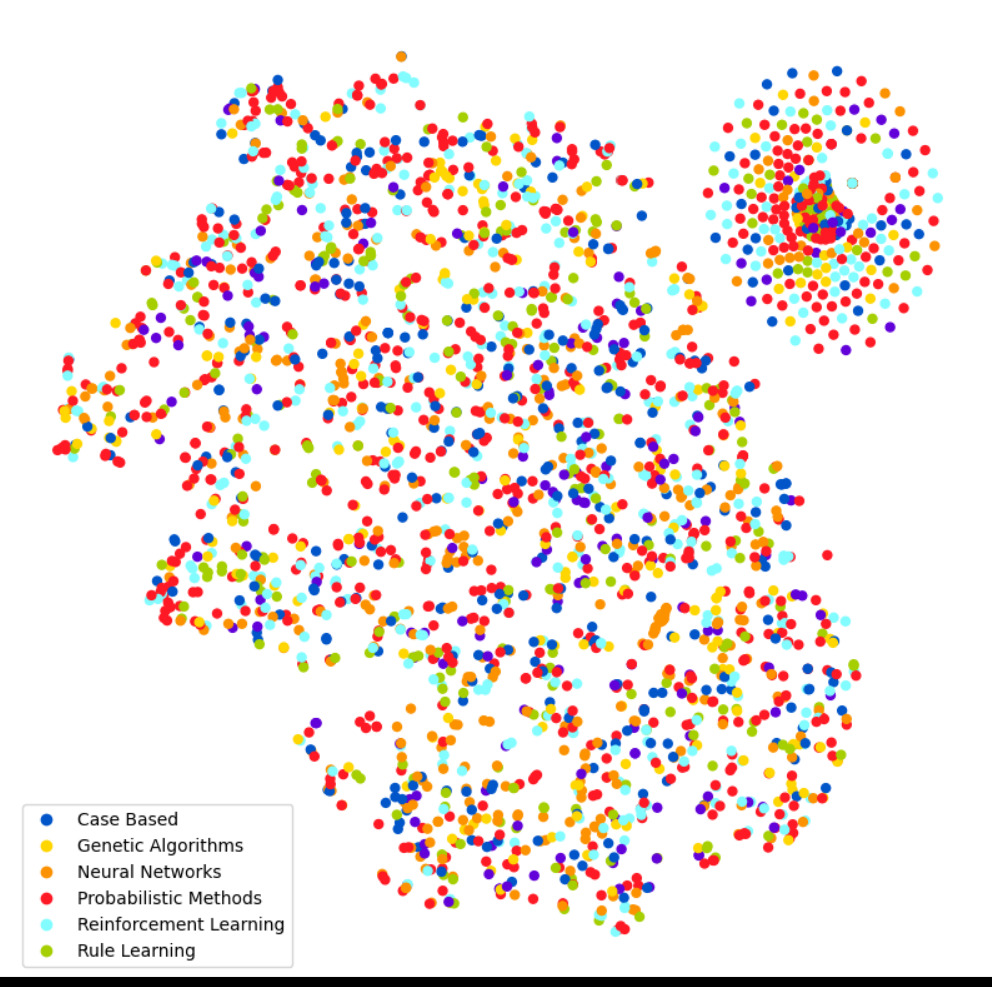
The network still needs to be trained. Without training, its output would look as shown in Figure 2. Nodes would be assigned to classes randomly and without any discernible structure.

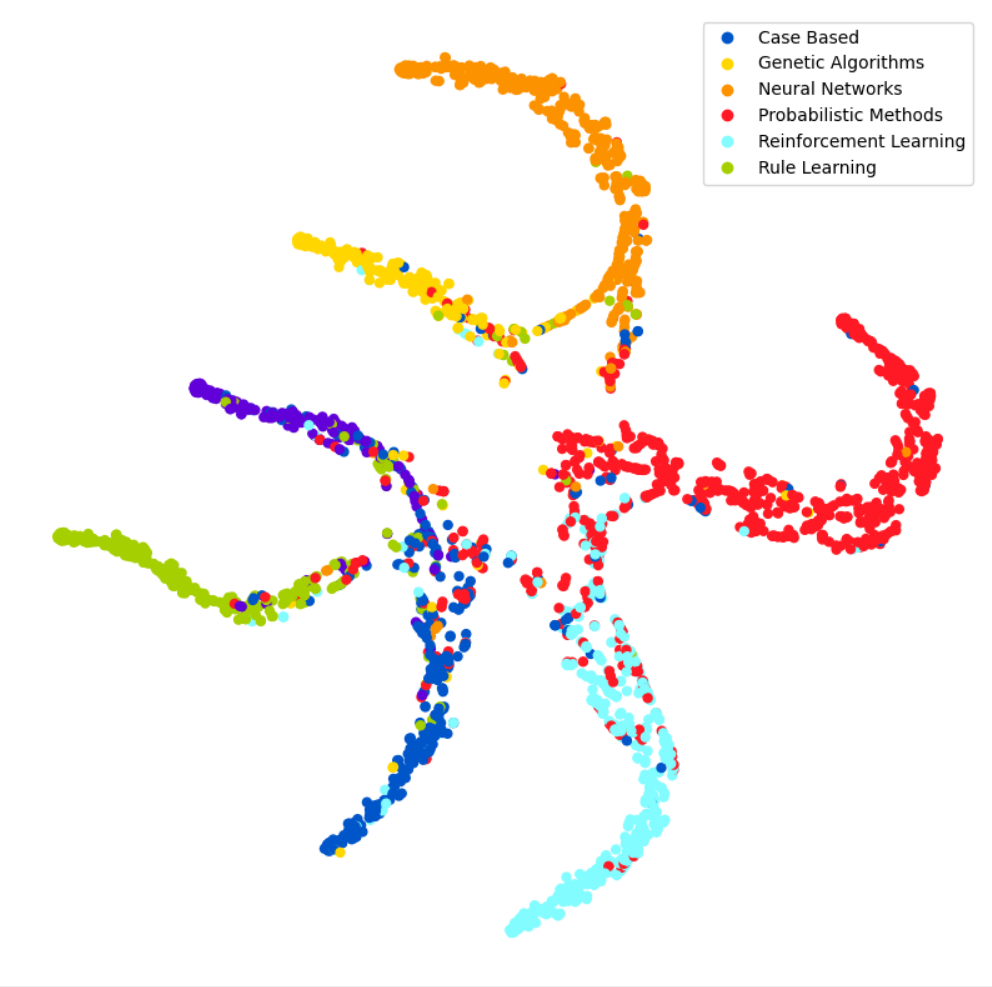
To prevent the model from overfitting to the training data, we use an early stopping mechanism. This halts the training if the best validation result achieved so far is not surpassed within a predetermined period. Once the network is trained, the test results appear as shown in Figure 3.

The various nodes have now largely been correctly assigned to their respective classes. The average classification accuracy of the GAT across 100 runs on the different datasets is shown in the following table.
| Model | Cora | CiteSheer |
| GAT | 80,5 ± 0,65% | 67,9 ± 0,90% |
It can be observed that our model performs better on the Cora dataset than on CiteSeer. One reason for this is that CiteSeer contains nodes with no neighbors, whereas Cora only includes nodes with a degree ≥ 1.
Outlook and conclusion
We demonstrated how a Graph Attention Network is structured and can be applied. By leveraging the normalized attention coefficient, the network can specifically learn important node connections in a graph, achieving better results than traditional methods. As an example, the GAT was trained on the Cora and CiteSeer datasets, and the results were presented. Since GATs can be applied to inductive datasets, they are well-suited for analyzing large graphs that remain unseen during training, such as those found in social networks. For this reason, the application domain of GATs is particularly broad, making them a valuable Machine Learning tool not only in research but also in industry.
