Medical data often contains complex patterns that are difficult to recognize with the naked eye, but which can be of great importance for further diagnoses and therapy. For example, there are hidden correlations between certain groups of people and the effect of a drug. Clustering methods are often used in the medical field to identify such structures. The goal is to summarize similar data points into groups, so-called clusters.
In these cases, the flexible clustering algorithm Gaussian Mixture Model (GMM) can be used, which is based on a probability model that describes data as a mixture of Gaussian distributions. By using GMMs on clinical and disease-related data, patients with similar symptoms or diseases can be grouped together based on their characteristics. This can help to gain a deeper understanding of diseases, predict treatment outcomes, and recommend appropriate medical interventions.
Basics: Gaussian distributions
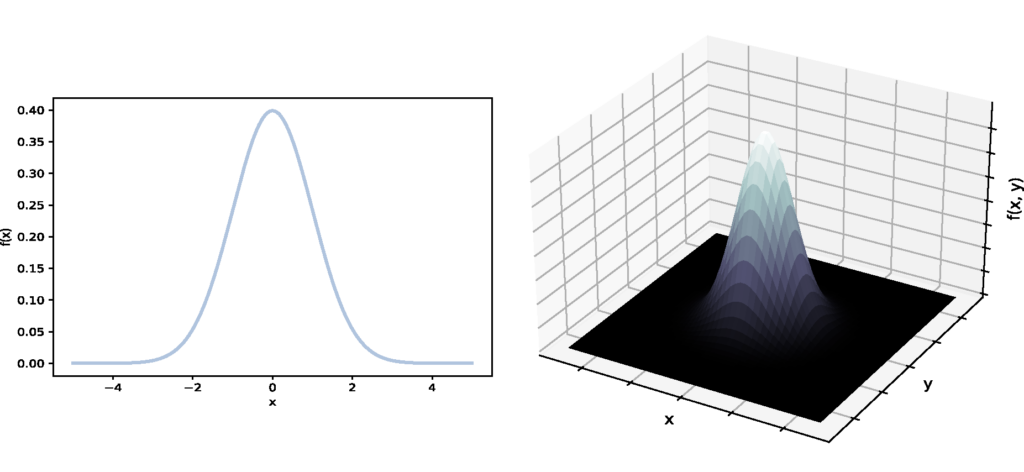
The basis of GMMs is the bell-shaped Gaussian distribution, which is also known as the normal distribution and as an important type of probability distribution for continuous variables. Many phenomena in nature such as the distribution of height or IQ values within a population approximately follow the Gaussian distribution. The Gaussian function indicates the probability that random variables, such as height, of assuming certain values.

Figure 1: On the left is a Gaussian distribution that depends on the random variable x. On the right is a Gaussian distribution that depends on the two random variables x and y.
A Gaussian distribution with several random variables (see Fig. 1, right) is defined by the following parameters: the mean vector, which indicates the typical expected values of the variables, and the covariance matrix, which measures the degree of linear correlation between the variables. A GMM consists of a combination of different Gaussian distributions. These are each weighted with a so-called mixing coefficient, which determines the influence of an individual distribution on the total distribution. Overall, the parameters of a GMM include the mixture coefficients, mean vectors and covariance matrices of the individual Gaussian distributions.

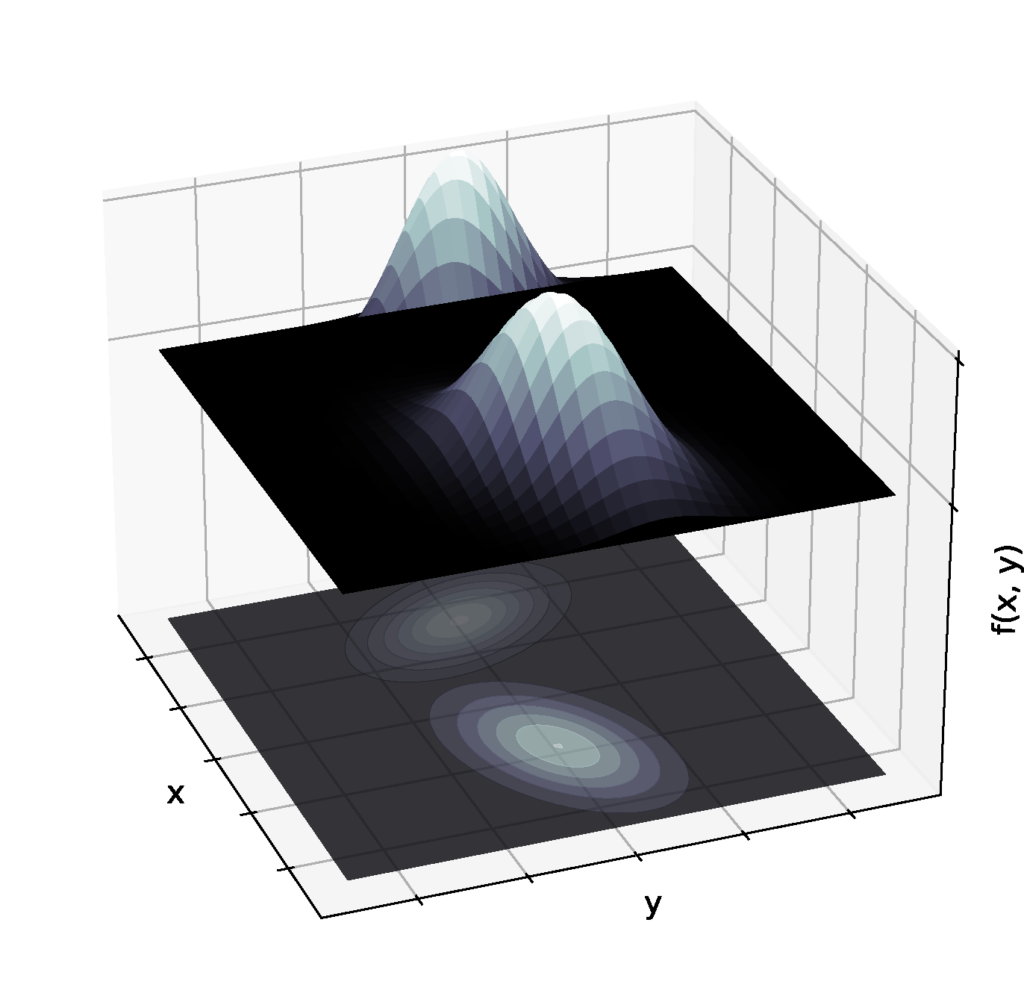
Figure 2: Two different Gaussian distributions and their contour plots.
But what is the relationship between GMMs and clusters? To answer this question, let us take a look at Figure 2, which shows two different Gaussian distributions. If we change the perspective and look at the distributions “from above”, we realize that each Gaussian distribution represents an elliptical cluster. This representation is also known as a contour plot. The position of the center and the shape and orientation of the clusters are determined by the parameters of the Gaussian distribution. The individual ellipses indicate how likely it is that a data point belongs to the respective cluster. According to the Gaussian function, this probability decreases from the center of the ellipse outwards in a bell-shaped manner. In summary, this means that GMMs can model various elliptical clusters, which we use for the clustering process below.
How does the clustering process work?

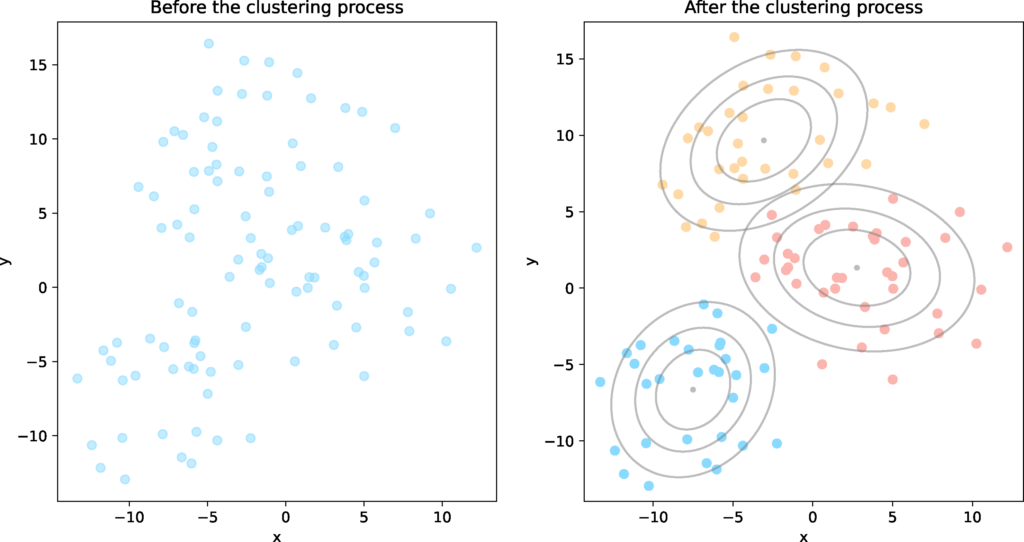
Figure 3: On the left are 100 data points as a function of the variables x and y. On the right, the data points are grouped into three different clusters after applying the expectation-maximisation algorithm.
We now know that a GMM can represent different clusters – but how exactly does the clustering process work? At first, we have a sample with several data points that we want to group into a given number of clusters. We assume that the data points can be described by a GMM whose cluster parameters (mixture coefficients, mean vectors, covariance matrices) are unknown. Our goal is to adjust these parameters so that the data points are optimally represented by the clusters (see Fig. 3).
To achieve this, we need to maximize the probability that the data points are described by a GMM. This probability is given by the so-called log-likelihood function, which depends on the unknown parameters. To maximize the log-likelihood function by estimating the optimal cluster parameters, we use the iterative, numerical expectation-maximization algorithm, which contains the following steps:
- Initialization: We start by initializing the values of the mean vectors, covariance matrices and mixing coefficients of the clusters (e.g. using the k-means algorithm).
- Expectation step: We then calculate the so-called responsibility for each individual data point. The responsibility indicates the probability with which a data point belongs to a cluster. In contrast to the k-means algorithm, GMMs are therefore also referred to as soft clustering methods, as the responsibility assigns “soft” probabilities instead of “hard” 0-or-1 assignments and a data point can be assigned to more than one cluster.
- Maximization step: Based on the calculated responsibilities, we update the cluster parameters and thereby approach the optimal parameters. The statistical method maximum likelihood estimation is used here, which aims to maximize the log-likelihood function.
- Evaluation: We now check whether the log-likelihood function converges, i.e. whether it no longer changes significantly. If the convergence condition is not yet fulfilled, we return to step 2 and repeat the expectation and maximization steps.
Overall, the expectation-maximization algorithm guarantees that the log-likelihood function is increased or remains the same in each parameter update in the maximization step. As a result, we approach a maximum point of the log-likelihood function after several iterations, so that our data is finally optimally described by the clusters of the GMM.
From theory to practice: Grouping diabetes patients

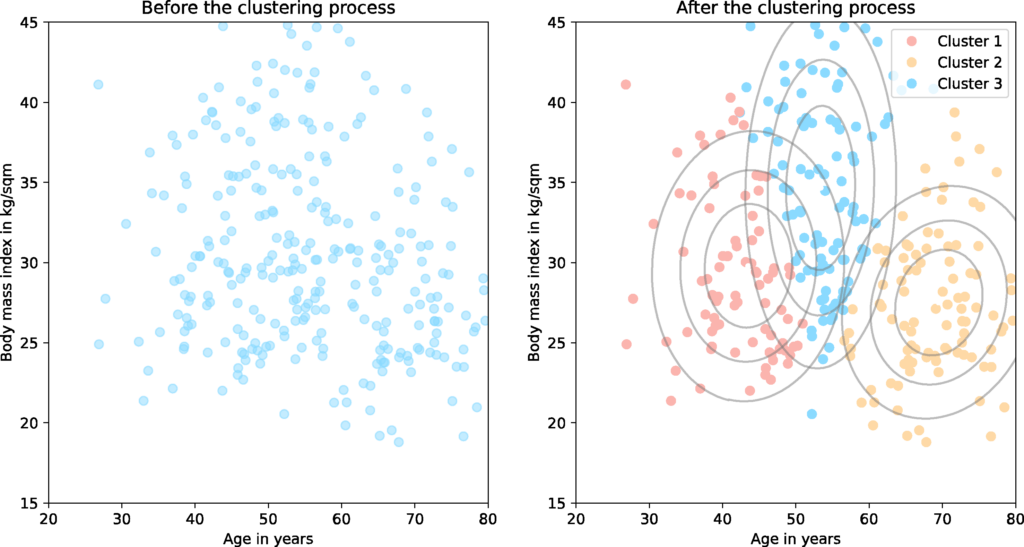
Figure 4: On the left are 300 data points representing people with type 2 diabetes depending on their age and body mass index. On the right, the individuals are grouped into three different clusters using the expectation-maximization algorithm.
How can we apply GMMs to medical data and what insights can we gain from them? We present a simplified example below: we asked 300 people with type 2 diabetes about their age and body mass index (BMI) (see Fig. 4, left). We aim to find out whether there are certain patterns in the data that could be helpful for further medical treatment. For this purpose, we assume that the data can be represented by a GMM with three clusters and then we apply the expectation-maximization algorithm to estimate the optimal cluster parameters. As a result, we obtain the clusters shown in Fig. 4 on the right.
In real research, many other dimensions are considered in addition to age and BMI, e.g. gender, blood pressure or family history. Each cluster represents a set of diabetes patients and is characterized by certain salient features. This grouping makes it possible to recommend appropriate medical strategies to patients, such as metabolic control for the first cluster or family-based interventions for the second cluster.
What are the advantages and disadvantages of Gaussian Mixture Models?
Advantages:
- Flexibility: By using Gaussian distributions, GMMs can flexibly recognize complex data structures, which enables a wide range of applications, e.g. for image segmentation or speech recognition.
- Modelling of uncertainty: In addition, the assignment of probabilities (soft clustering) allows the modelling of uncertainty in data sets. Such uncertainties are often found in medical data sets, so that data points can be assigned to clusters with high accuracy using GMMs.
Disadvantages:
- High computational effort: Compared to the k-means algorithm, the expectation-maximization algorithm requires significantly more iterations until convergence. This can become a problem, particularly in medical data, which often contains a large number of data points. To increase efficiency, the k-Means algorithm is therefore often used for initialization.
- Overly complex model: In some cases, overfitting can occur, which means that the GMM is too complex and can no longer precisely assign data points to clusters. A possible solution is to reduce dimensionality of the clusters.
Summary and conclusion: Gaussian Mixture Models as a flexible clustering algorithm
To summarize, Gaussian Mixture Models are a flexible, versatile soft clustering method based on a probability model that describes data as a mixture of Gaussian distributions. The aim of the clustering process is to summarize similar data points into clusters. In addition to maximum likelihood estimation, the iterative expectation-maximization algorithm is used.
GMMs enable the discovery of previously unknown structures and patterns and can simplify the diagnosis and treatment of diseases, when applied to medical data. Overall, GMMs can be used in a variety of ways and are particularly suitable when clusters have different shapes and sizes or there is uncertainty in the assignment of data points. However, GMMs also have some weaknesses, such as a high computational effort for large data sets and the tendency to overfitting. But in combination with other methods, these can be counteracted.
